
Slow internet can be frustrating, but identifying the root cause doesn’t have to be. With the right free Network Tools, you can quickly pinpoint what’s affecting your network’s performance. I rely on Angry IP Scanner to map all connected devices, PingPlotter to monitor latency and packet loss across each hop, and iPerf to measure real bandwidth between devices.
Using these tools in sequence provides a comprehensive view of both your local network and your internet connection. In this guide, I’ll show how these free utilities help diagnose slowdowns efficiently, saving time and frustration while keeping your network running smoothly.
Read More: Choosing the Right LMS by Aligning with Your Training Goals
Angry IP Scanner
Network device discovery
I always start with Angry IP Scanner to see exactly which devices are connected to my network.
Recently, when my online game latency spiked, I could have blamed neighbors for sneaking onto my Wi-Fi—but I checked my network first. Launching Angry IP Scanner gave me a complete view of every connected device.
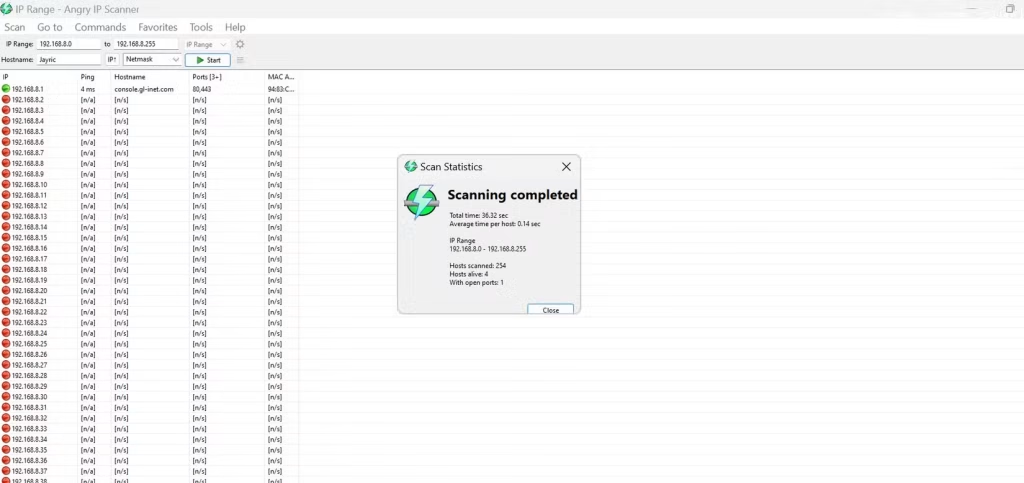
After downloading the official 64-bit installer, the tool automatically detected my network range. One click on Start quickly scanned 254 possible addresses in just 36 seconds. Color-coded results made it easy to read: red for inactive, blue for active, and green for devices with open ports. The scan confirmed my router at 192.168.8.1 and revealed four active hosts.
One device stood out as particularly busy—but it turned out to be my smart TV downloading its monthly YouTube updates, not a neighbor hijacking my Wi-Fi.
Angry IP Scanner’s ability to show MAC addresses and open ports alongside IP addresses makes device identification simple, even when hostnames are unclear. Exporting results to CSV allows me to track changes over time and quickly spot any new devices on my network.
PingPlotter
Continuous path monitoring
After mapping my network with Angry IP Scanner, I use PingPlotter to see how internet traffic behaves on its way out. It provides continuous visibility into latency and packet loss across every hop between my PC and any destination.
I installed the free version from PingPlotter’s official site. After the 14-day trial, it reverts to PingPlotter Free, which still covers all my WAN troubleshooting needs. I simply enter a target, like google.com, and hit Start. A 15–30 minute capture usually reveals everything I need.
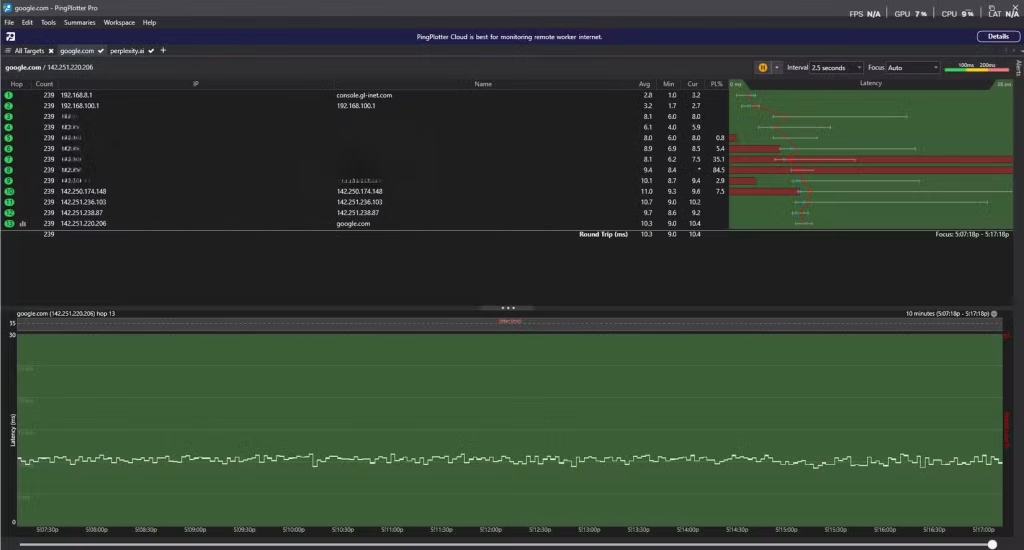
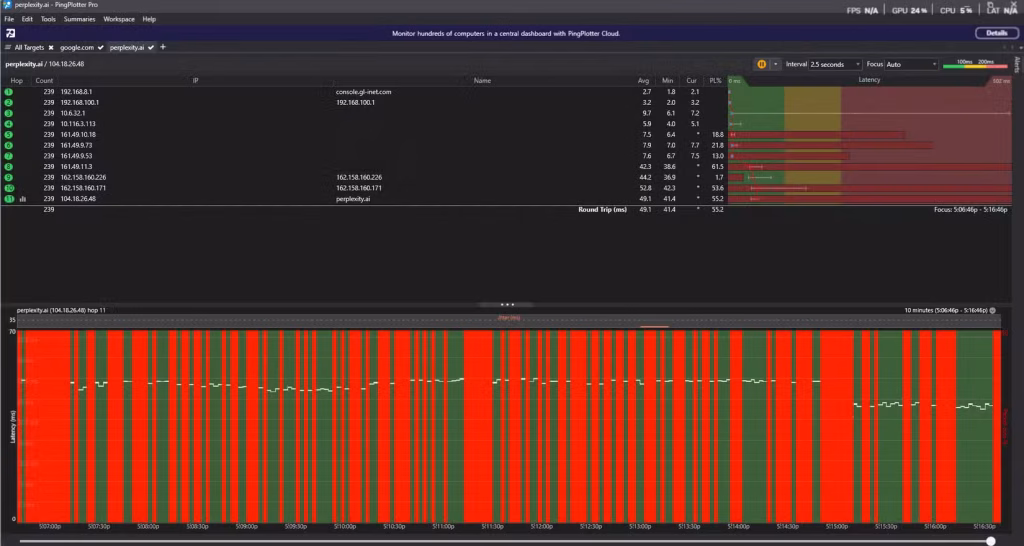
The interface shows each hop from my router to the destination, including IP addresses, hostnames, average latency, and packet loss.
When I noticed Perplexity slowing down, I tested both Google and Perplexity. Google showed stable performance—latency stayed low, and packet loss was minimal. Perplexity, however, displayed massive red spikes, with 55.2% packet loss at the final hop. This made it clear the issue was on their servers, not my connection.
PingPlotter is invaluable because it pinpoints exactly where problems occur, saving me hours of troubleshooting and preventing unnecessary complaints to my ISP.
iPerf
Precise throughput testing
While PingPlotter monitors stability and latency, iPerf measures raw bandwidth between devices, helping identify bottlenecks within your network. You can test any two devices with iPerf installed—whether it’s a NAS and PC, a Plex Media Server and smart TV, or two PCs. In my example, I tested my Windows PC and Android smartphone.
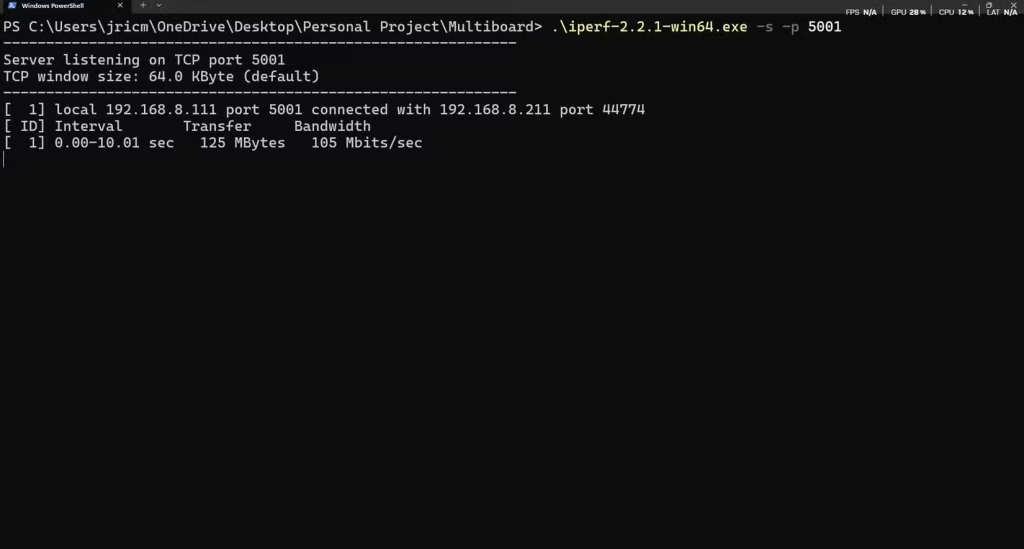
I downloaded the Windows version from SourceForge and the Android app from the Play Store. Setting my PC as the server, I ran:
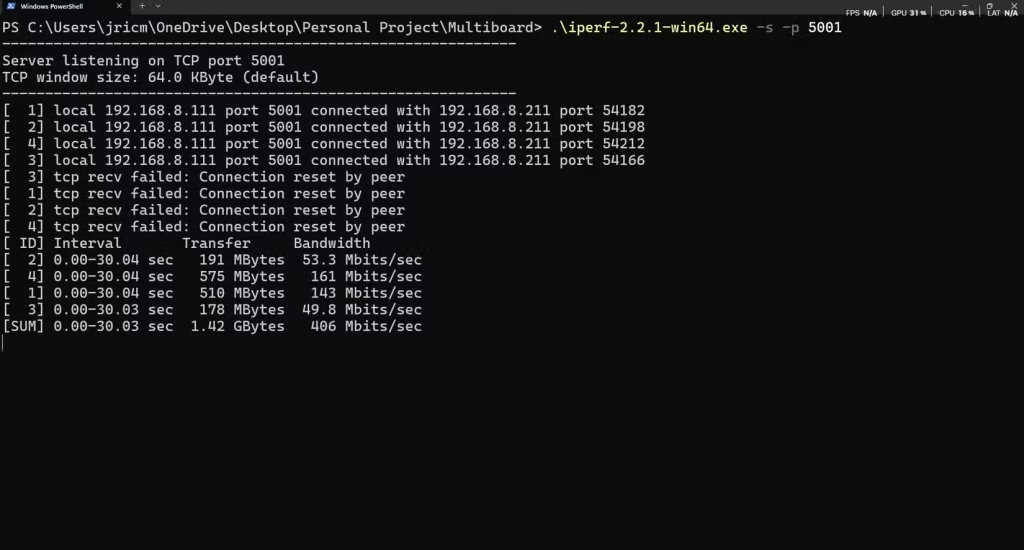
./iperf-2.2.1-win64.exe -s -p 5001
On my Android client, I tested TCP performance with:
iperf -c 192.168.8.111 -p 5001 -t 30 -P 4
The test transferred 1.42 GB in 30 seconds over Wi-Fi 5 on the 2.4 GHz band—a solid result. For UDP testing, I used:
iperf -c 192.168.8.111 -p 5001 -b 100M -t 10
This confirmed my phone could handle over 100 Mbps. TCP testing shows real-world throughput, while UDP highlights potential packet loss under load. I chose iPerf2 for Windows compatibility; iPerf3 works better on Linux.
Using these three tools in sequence—Angry IP Scanner to map devices, PingPlotter for WAN analysis, and iPerf for bandwidth testing—lets me troubleshoot network issues quickly. This method has helped me solve problems, ranging from routing errors to misbehaving IoT devices, often in under 30 minutes, rather than hours of guesswork.
Frequently Asked Questions
What are the best free tools to diagnose internet slowdowns?
Some of the most effective free tools include Angry IP Scanner for mapping devices on your network, PingPlotter for monitoring latency and packet loss, and iPerf for testing bandwidth between devices. Using these together gives a complete view of your network.
How does Angry IP Scanner help identify slow internet?
Angry IP Scanner shows all devices connected to your network, along with IP addresses, hostnames, MAC addresses, and open ports. By identifying unexpected devices or network congestion, you can pinpoint sources of slow performance.
What is PingPlotter, and why is it useful?
PingPlotter continuously monitors latency and packet loss across each hop from your PC to a server. It helps you determine whether slow internet is caused by your network, your ISP, or the target server.
How does iPerf test my network speed?
iPerf measures raw throughput between devices on your local network, in both TCP and UDP modes. This reveals potential bottlenecks and helps you verify whether your network can handle large file transfers or streaming.
Can these tools detect Wi-Fi issues?
Yes. Angry IP Scanner identifies all connected devices, PingPlotter monitors connection stability, and iPerf tests bandwidth between devices. Together, they can highlight weak Wi-Fi signals, interference, or overloaded devices.
Do I need technical skills to use these tools?
Basic computer skills are sufficient. Angry IP Scanner and PingPlotter have user-friendly interfaces, while iPerf requires simple command-line commands for testing. Clear tutorials and examples make setup straightforward.
How quickly can I diagnose network problems using these tools?
With a systematic approach—mapping devices, checking WAN performance, and testing throughput—you can often identify the source of slow internet in under 30 minutes, instead of hours of guesswork.
Conclusion
Using free tools like Angry IP Scanner, PingPlotter, and iPerf makes diagnosing slow internet straightforward and efficient. Angry IP Scanner maps your network and reveals all connected devices, PingPlotter tracks latency and packet loss across your connection, and iPerf tests real bandwidth between devices. By using these tools together, you can quickly identify bottlenecks, misbehaving devices, or external server issues—often in under 30 minutes.